
Clinerion’s RWD RADAR delivers aggregated data from de-identified, unlinked patient data from Clinerion’s global hospital network:
- Incidence timeline per EHR field code.
- Gender and age distributions per EHR field code.
- Immediate results based on real-time data.
- Aggregated or geographically mapped.
RWD RADAR can be used for epidemiology studies to look at disease occurrence, treatment metrics, differences by hospital, region and country as well as to identify differential treatment groups or cohorts by local, procedure or medication (segmentation by different treatment options and/or by drug/drug class). As Clinerion`s patient network expands this will provide deep insights into hard to find patient groups, locations and countries that are unique to Clinerion.
Example use cases:
|
|
|
Use cases: example data and queries in context with Clinerion’s Patient Network Explorer:
|
|
|
Clinerion also offers RWD RADAR as an automated data export.
Download the Information sheet >
RWD RADAR is based on statistical data generated daily for each terminology code from each Patient Network Explorer partner hospital. Statistics are also generated per code for distribution by gender and age. Queries provide findings for a single code. Since no patient IDs are accessed, it is not possible to get results for combined queries such as “number of patients for diagnosis A and medication B”.
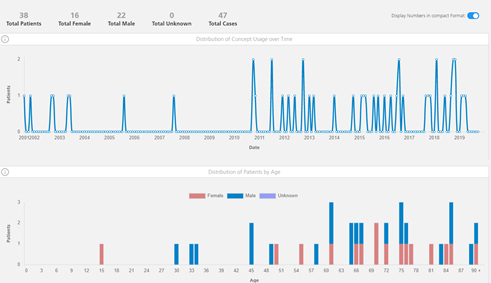
Figure 1: Statistic distribution for ICD10 C95.9 Leukemia (unspecified) at a partner hospital.
The Patient Network Explorer cloud receives aggregated statistical data, reporting overall occurrence numbers and cannot be tracked back to individual patients on site. As a core principle, at no time is individual patient data sent out of the hospital to Patient Network Explorer. Links to patient IDs are removed before the statistics are sent to the Patient Network Explorer cloud.


